Spot prices show where the market is. Option prices show what it pays to insure itself: against what, on which side, and until when. Four numbers say most of it.
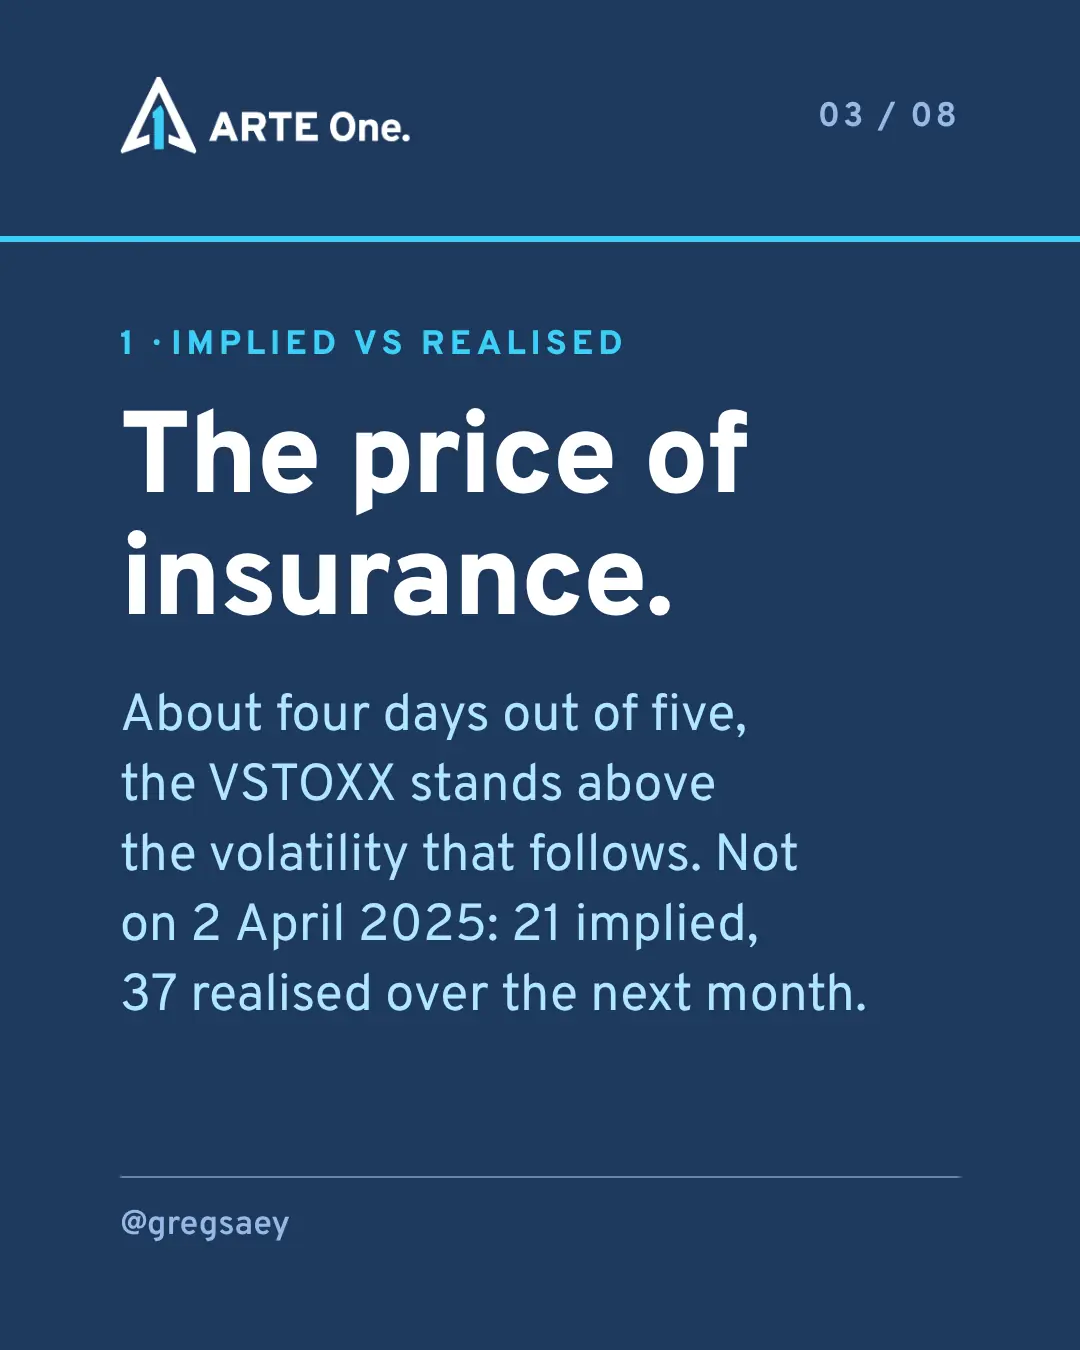
1. Implied against realised: the price of insurance
Implied volatility is what the market charges today for protection over the coming month. Realised volatility is what actually happens. About four days out of five, the VSTOXX stands above the volatility that follows: insurance usually costs more than the damage it covers.
Not on 2 April 2025. That day the VSTOXX stood at 21. Realised volatility over the following month came out at 37.
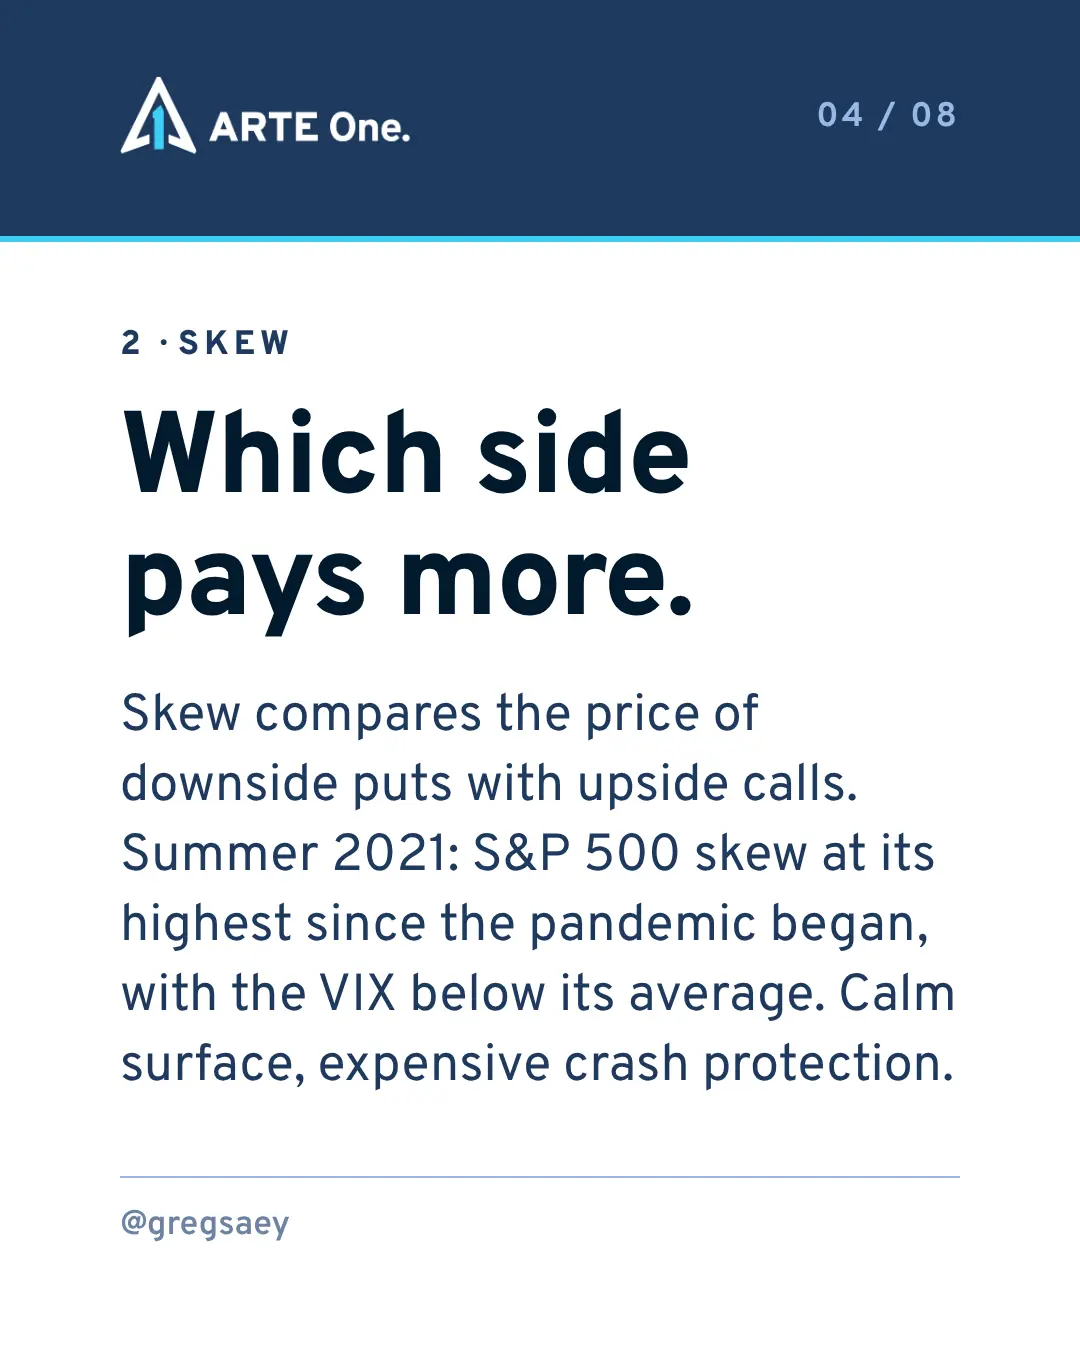
2. Skew: which side pays more
Skew compares the price of downside puts with upside calls. In the summer of 2021, S&P 500 skew was at its highest since the pandemic began, while the VIX sat below its average. A calm surface, and expensive crash protection underneath.
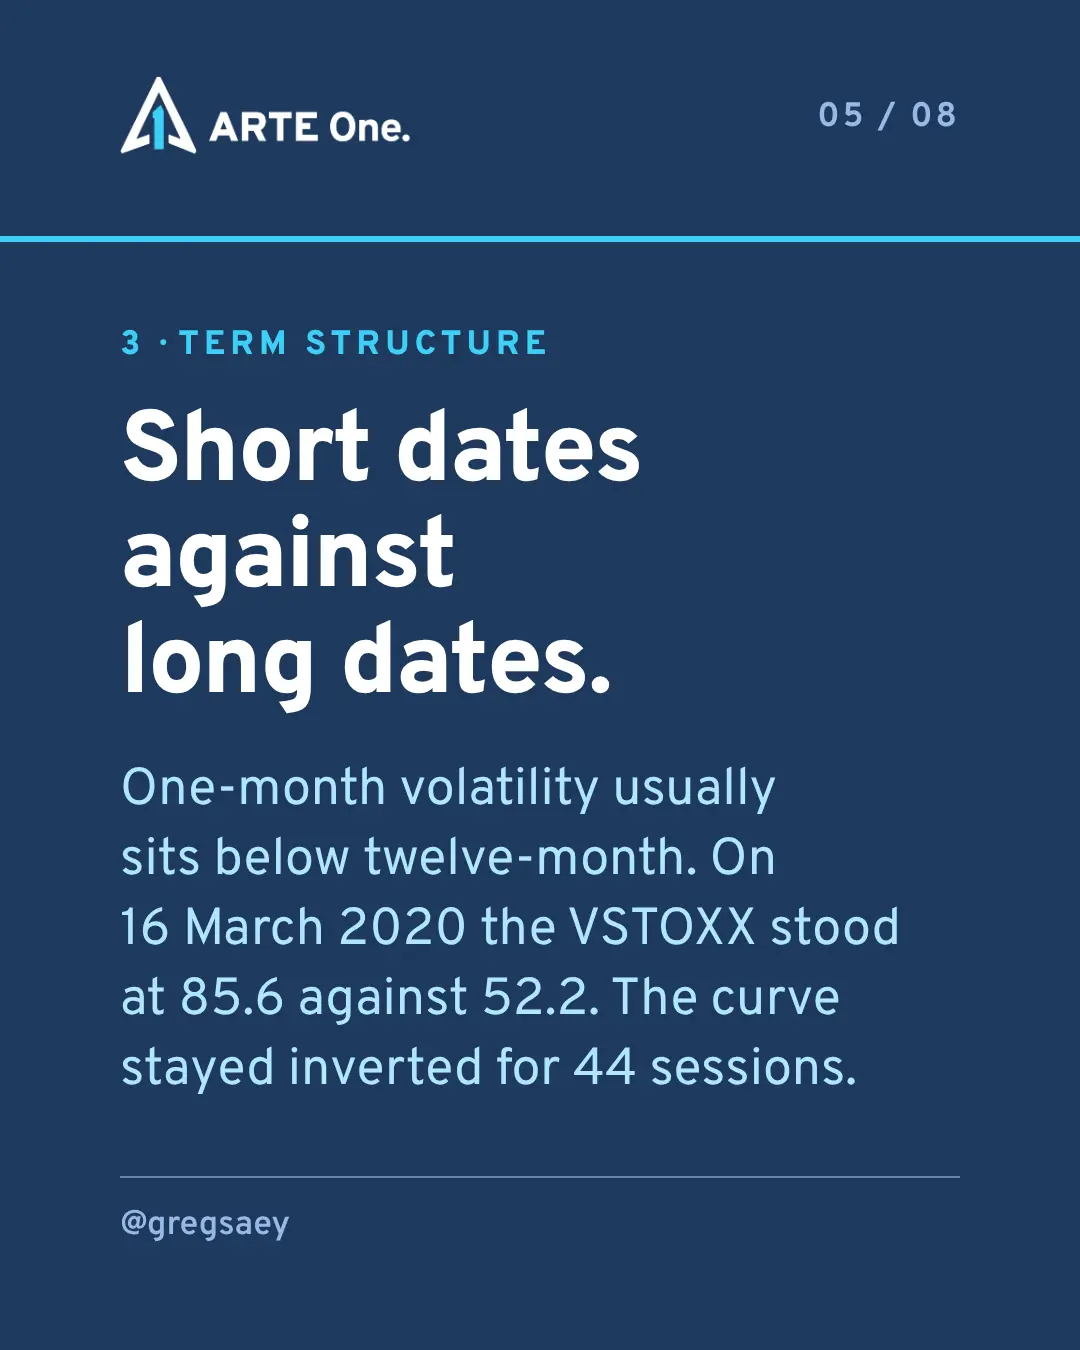
3. Term structure: short dates against long dates
One-month volatility usually sits below twelve-month volatility. When the short end jumps above the long end, the market is paying for the next few weeks, not the next year. On 16 March 2020 the VSTOXX stood at 85.6, against 52.2 for twelve-month volatility. The curve stayed inverted for 44 sessions.
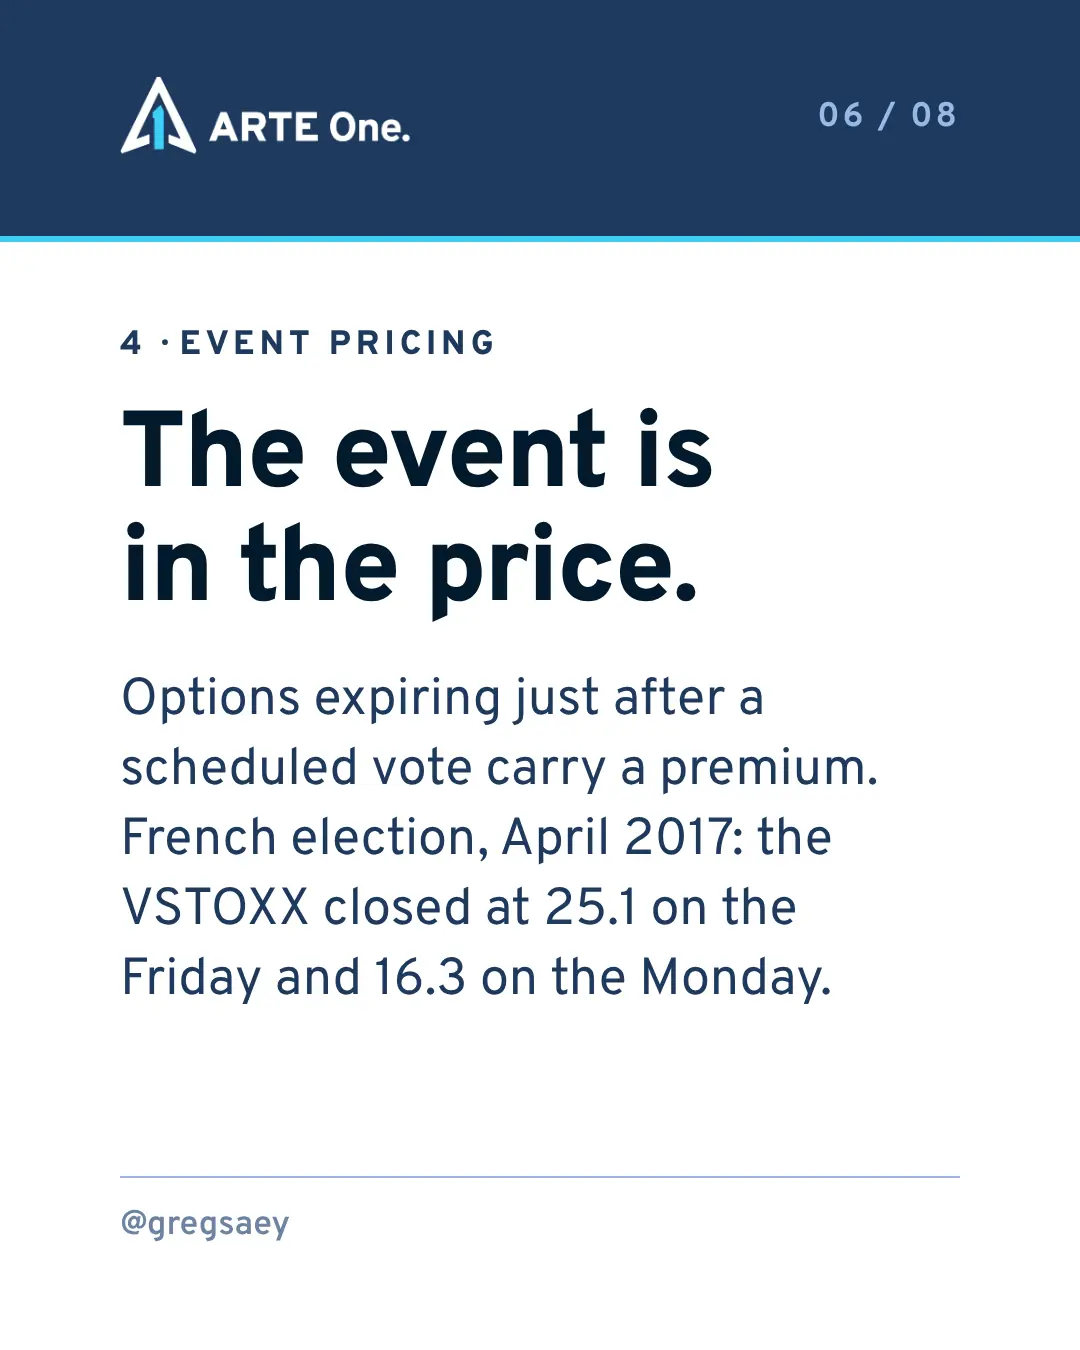
4. Event pricing: the event is in the price
Options expiring just after a scheduled vote carry a premium. Around the first round of the French presidential election in April 2017, the VSTOXX closed at 25.1 on the Friday before the vote and at 16.3 on the Monday after.
Read together
What is the market paying to insure, on which side, and until when? I ask that question before I read any macro view.
The post as published on Instagram
For information only. Not an offer or solicitation. Nothing on this site is investment advice or a recommendation.